Assume that you are the proud owner of a gold mine, but you are unable to extract the gold from it. So, what’s the point of owning something? Is this the case? The situation is the same with Big Data.
It is pointless to collect troves of data if you are unable to churn it and extract the knowledge hidden behind it. Data visualization tools are the precise weapons you need to overcome this problem. These technologies provide us with a proliferation of insights into the data obtained. Google and Microsoft, for instance, gather and utilize Big Data to shape the future of their commercial operations.
Today, we’ll look at some of the most popular Big Data Visualization tools.
Google Chart
Google is a clear benchmark and is well renowned for the user-friendliness of its products, and the Google chart is no exception. It is one of the most user-friendly tools for displaying large data sets. Google Chart has a large collection of chart galleries, ranging from a simple line graph to a complicated hierarchical tree-like structure, and you may choose any of them that meet your needs. Furthermore, the most crucial aspect of developing a chart is customization, which is very limited to Google charts. If you want to go deep, you may always ask for technical assistance.
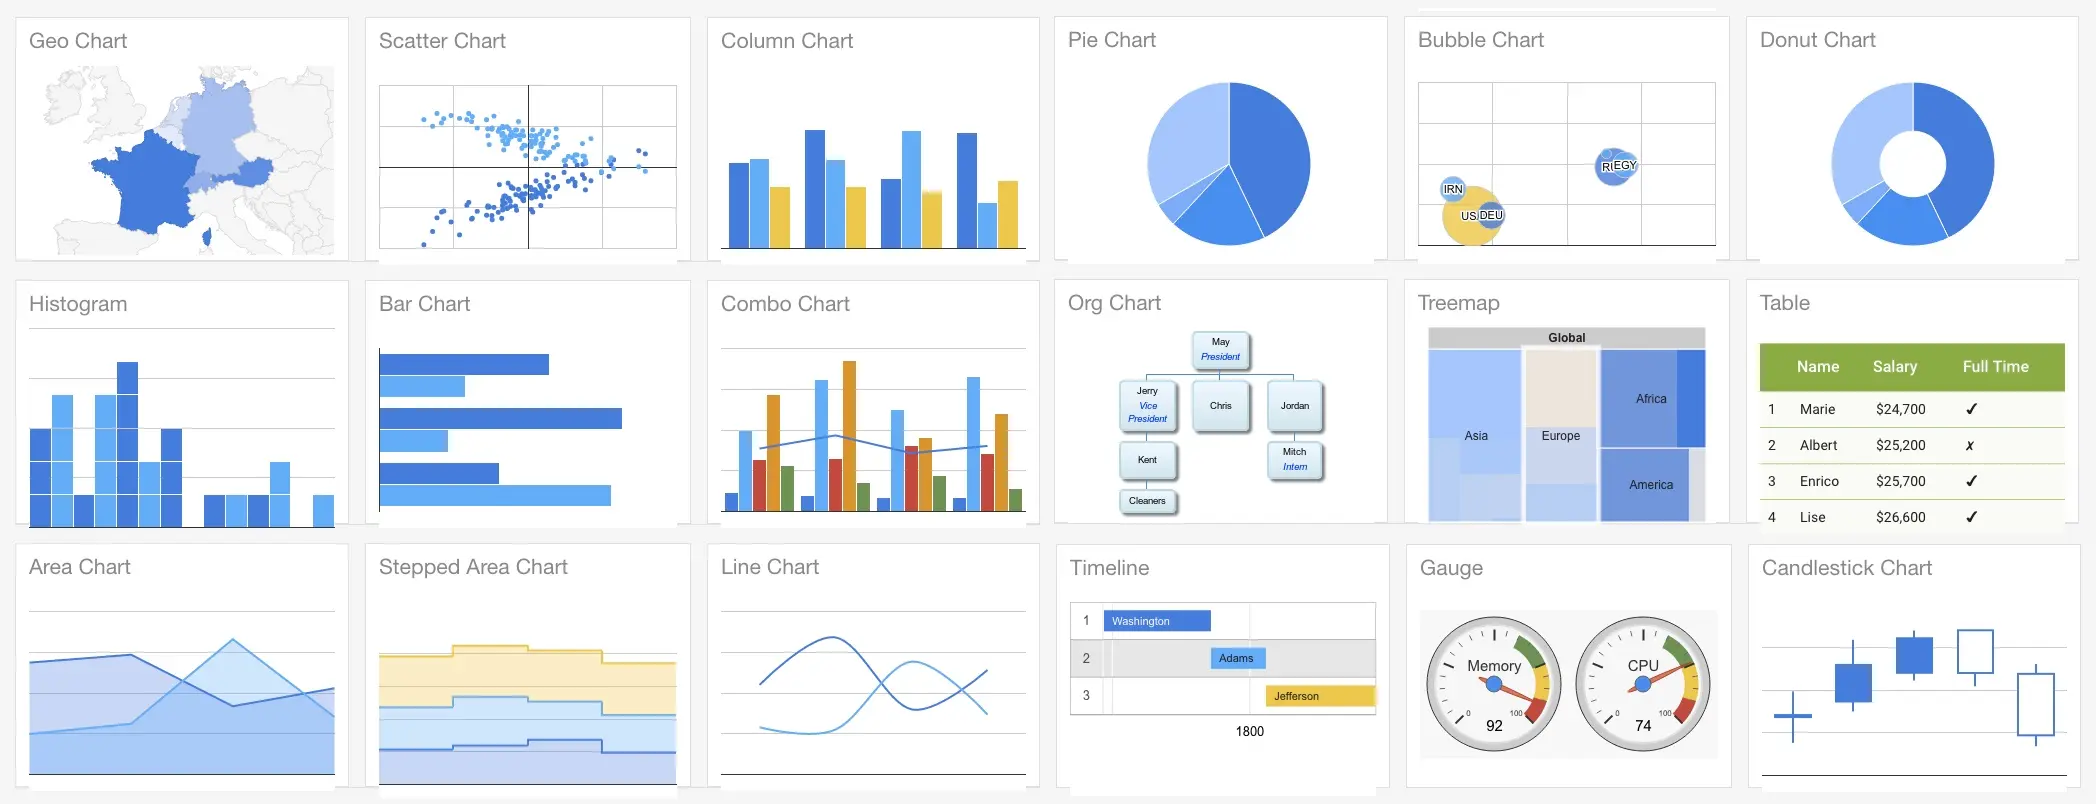
It displays the chart in HTML5/SVG format and is browser-independent. In addition, it has embraced VML for supporting outdated IE browsers, which is cross-platform compatible, transferable to iOS, and the new Android version. The data from the chart may be readily exported to PNG format.
As a result, Google Chart is quite effective at managing real-time data. You can also combine data from other Google products, such as Google Maps, with your current data to create an interactive chart, which you can manage from an interactive dashboard. Furthermore, the service is completely free and has the full support of Google.
Tableau
This desktop is a fantastic data visualization application (SaaS) for manipulating large amounts of data that is free to use. It also includes two further editions, "Tableau Server" and "Tableau Online," which are specifically built for large data-related organizations.
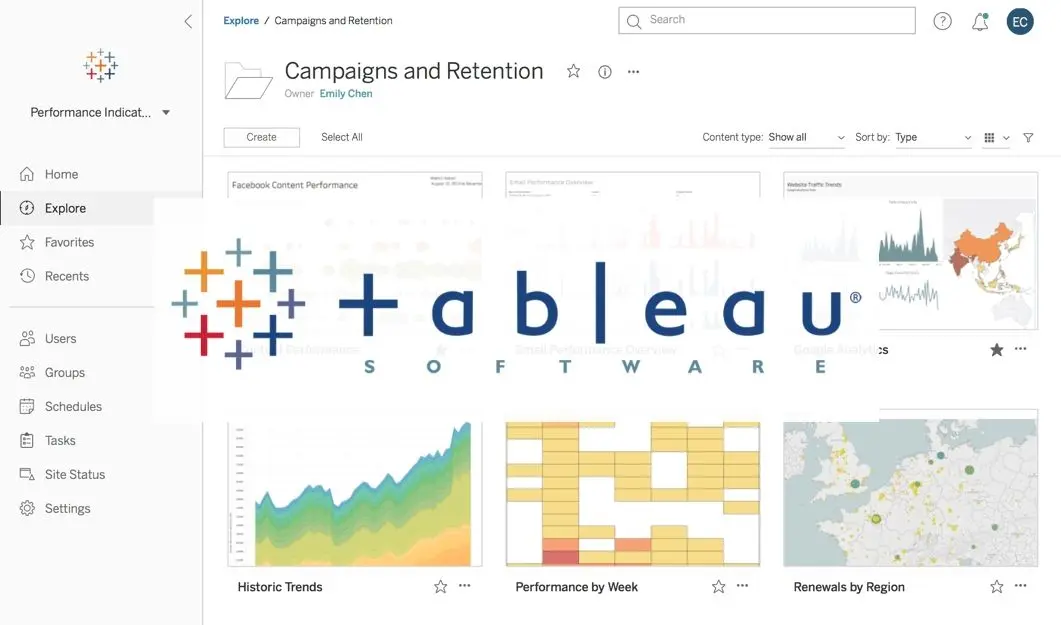
You do not need to be a programmer to utilize this tool. This tool is quite useful and gives a lightning-fast performance. Because the canvas or dashboard is user-friendly and 'drag and drop' compatible, it offers a welcoming setting in any working environment. You can link all of your data, from a spreadsheet to a Hadoop cluster, and analyze it thoroughly. Tableau Desktop is available for free to students and educators.
D3.js may be used to visualize Big Data in virtually any way.
D3.js is an abbreviation for Data-Driven Document, a JS toolkit enabling interactive Big Data presentation in basically ANY real-time fashion. Given that this is not a tool, a user should have a basic grasp of Javascript in order to interact with the data and display it in a human-readable format. To elaborate, because this library presents the data in SVG and HTML5 formats, earlier browsers such as IE7 and 8 are unable to take advantage of D3.js features.
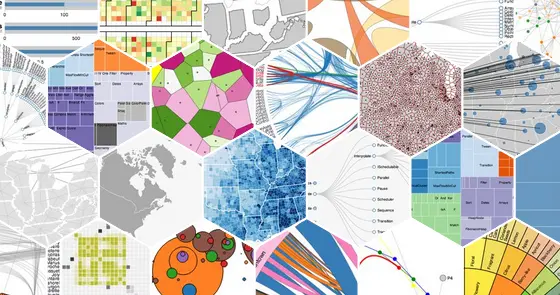
Data from different sources, such as large-scale data sets, is bonded in real-time with DOM to make interactive animations (2D and 3D alike) in an exceptionally fast manner.
Fusion Diagram
Fusion chart XT is a Javascript charting library for the web and mobile devices that are used by Google, Intel, Microsoft, and many other companies. However, you will need a basic understanding of Javascript to implement it.
Technically, it collects data in XML or JSON format and presents it using Javascript (HTML5), SVG, and VML charts. It has over 90 chart types in both 2D and 3D graphic formats, as well as a variety of functions such as scrolling, panning, and animation effects. It also includes over 950 maps of various locations throughout the world.
Wrapping Up
This is only the tip of the iceberg in terms of Big Data visualization solutions and tools, both online and standalone. Each firm may choose the solution that works best for them and assists them in converting raw data input into a collection of easily converted visuals and graphs.
Data has no value in and of itself; it is the decisions that it aids in making that generate value - and data visualization tools aid in identifying trends and patterns in order to make sound business judgments.
Subscribe to Our Newsletter!
Join us to stay updated with our latest blog updates, marketing tips, service tips, trends, news and announcements!


